
This post examines the early state of administrative data that the public and authorities used to understand the beginning stages of the COVID-19 pandemic. It highlights challenges in data collection and reporting across different organizations and countries.
- Redundancy and overlap among 14 major COVID-19 publicly available data sources (e.g., WHO, Johns Hopkins University, Worldometer, Google, Wikipedia). Many organizations relied heavily on each other’s datasets without clear attribution, creating an ecosystem where data frequently “fed on itself” rather than representing fully independent measurements.
- Under immense pressure, local hospitals, labs, and health departments often lacked standardized procedures. Early differences in basic definitions (e.g., what constitutes a COVID-19 case or death) compounded these problems.
- In authoritarian countries, data were deliberately manipulated for political reasons (e.g. Iran and Russia).
- Lesson: Data infrastructures in crisis conditions are prone to systemic error. Future research and policy analysis must take these foreseeable flaws into account.
Let’s remember, unfortunately, the chaotic and fearful early months of the Covid-19 pandemic.
The Covid-19 pandemic was a modern-day disaster, the severity of which the media broadcasted, via tables and graphs, the growth and decline in cases and mortality across nations and time. In these broadcasts we viewed the pandemic’s spread within and between nations.
These broadcasts were based on administrative data that various people and organizations collect, harmonize, and aggregate. For months, these data producers provided data on counts past and present, and many have made their raw data available in machine-readable form for public scrutiny. An intention was to guide policy-makers and educate the public.
These data were the empirical foundations for the innumerable analyses on the virus’ impact, and possible projects for data harmonization.
I ask a critical question: What data are available for harmonization and aggregation, and who produces and distributes them? This brief note outlines the administrative data sources on the Covid-19 pandemic.
A House of Mirrors: Early Administrative Data Providers on Covid-19 Cases and Mortality
In today’s information age, if data can be collected, they will be collected.
This was true for Covid-19. There are a great many sources of case and mortality data, or what can be called “counts,” which are widely available for modelers and media. In the early stages of the pandemic, many organizations, through their websites, reported these counts. These organizations harmonized the data and provided aggregate counts for localities at various levels of administration. Many, but not all, provided their data in github, a data and computer program repository[i].
To make sense of these data, I ask two basic questions: What are the sources of these data, and to what extent are these data redundant, i.e. do these data sources overlap?
I define overlap as the situation in which an organization can rely, in part or in whole, on another’s website for the same data.
To address these questions, in April 2020, at the height of the pandemic, I visited 14 different websites[ii] that report Covid 19 counts across nations and time[iii] such as one would find in the newspaper: WHO, ECDC[iv], Google “COVID 19”, Bing/covid, Wikipedia, Johns Hopkins University (JHU) COVID Tracker, The New York Times, 1point3acres , Worldometer , Humanitarian Data Exchange (HDX), Healthdata.org, HealthMap, Statista, and Reuters Graphics. On these websites, I searched for information on where they get their data.
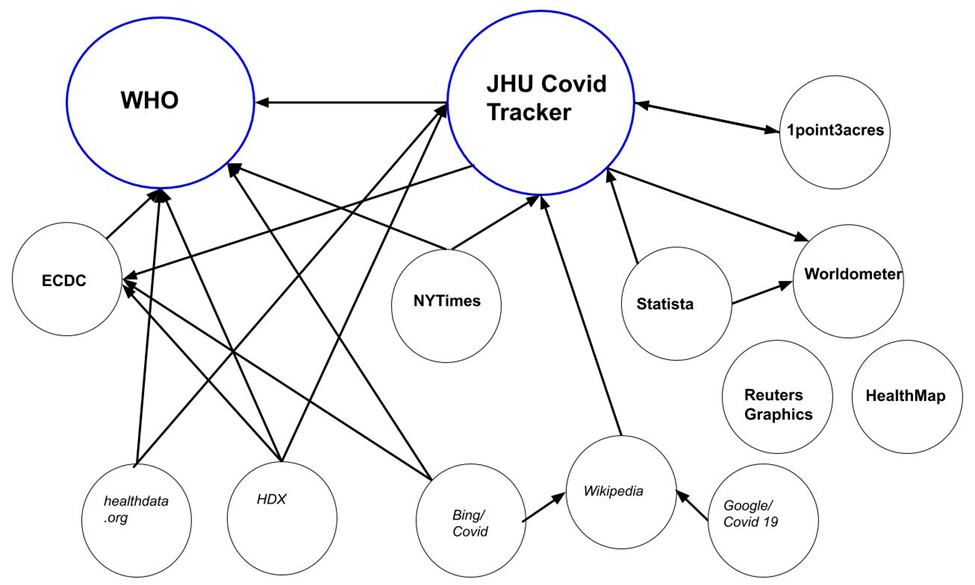
Figure 1. Map of 14 “Covid 19” Data Sources of Cases and Mortality
Note: Data hubs in large print and in blue circles. Those that claim to collect their own data, perhaps in addition to using other sources within this network, are in bold. Organizations that do not claim to collect their own data, but instead rely on others in this network (and perhaps those outside of this network), are in italics. A line indicates a data relationship between one organization and another. –>Arrows point to the source of their data.
In their textual descriptions, the data providers were often vague about their exact data sources. Some boasted about the diversity and amount of sources they used. For example, the initially popular 1point3acres reported in their FAQ:
“Where does your data come from? We have a mix of scripts, API calls, and user submissions. Our data team then jumps in and fact check, cross referencing difference sources, de-dup and make sure we present most accurate data from credible sources… we use data from COVID Tracking and JHU (Rest of the World).”
The European Union’s ECDC claimed that “a team of epidemiologists screens up to 500 relevant sources to collect the latest figures.[i]” Worldometer wrote that they “validate the data from an ever-growing list of over 5,000 sources.”
Of the 14 I examined, only three did not overtly claim to overlap: WHO, Worldometer, and Healthmap. Worldometer may have described their overlap within the 5000+ sources they claimed to use, but because I did not have the patience to go through 5000+ sources, and they did not list WHO or JHU specifically on their website, I included them as not-overlap. Healthmap’s description of sources was too vague to be certain[ii]. This means that heterogeneity of sources was common. In drawing from data within this group, JHU Covid Tracker was one of the most heterogeneous, as it depended on four sources: WHO, ECDC, 1point3acres, and Worldometer. Bing/Covid depended on three sources: WHO, ECDC, and Wikipedia and thus, without explicit mention, Bing/Covid depended on JHU Covid Tracker.
Within the group of 14, there were two main data hubs, defined as those whom others within the group depended on for counts: WHO and JHU Covid Tracker, each with six out of 14 who depended on them to some extent (Figure 1, circle in blue). Other organizations claim to have collected their own data, as well: Nine of the 14 claimed to collect their own data (Figure 1, names in bold) whereas five did not claim this (names in italics).
Overlap was common: of the 14 data sources I examined, 11 of them relied, in part, on statistics provided within this group. For cross-national counts, Google/Covid 19 depended solely on Wikipedia. For these same counts, Wikipedia depended solely on Johns Hopkins University (JHU) Covid Tracker. Although Google and Wikipedia did not mention this explicitly on their websites, both depended on the same source — JHU. The New York Times depended, in part, on WHO and JHU Covid Tracker.
Of course, data providers within this group relied on information outside of this group. Sources of data, in addition to this group of data providers, included public authorities (various national health authorities and various subnational health authorities, including their press conferences and social media presence), the mainstream media, social media (Twitter, Facebook, Telegram), specialty media sources that most people have never heard of, such as BNO News and 24/7 Wall St., and what these organizations call “user submissions,” meaning that anybody in the world can contact them to report some information that could, perhaps, be included in their data set.
In sum, many of these sources relied on other organizations within these sources, and thus this group tended to feed on itself.
In the chaos that was the early pandemic period, organizations rushed to fill in the information gap. Some were motivated by the common good, but others may have been motivated by making money on spreading pandemic data. The result was a chaotic ecosystem of Covid-19 information. There is no indication that this chaotic information ecosystem harmed anyone.
But, the under-count of Covid-19 that was the basis of government policies most likely did harm people by under-emphasizing the dangers that Covid-19 posed to vulnerable populations.

Data Providers Depend on Upstream Reporting
Data collection of counts is difficult. At root, these organizations depend on various national and subnational data sources that, in turn, depend on hospitals, labs, and other health organizations and medical authorities, which in turn depend on professionals within those organizations to report on identifiable Covid 19 cases and deaths.
We have some descriptions of early upstream reporting from the US via the CDC. Descriptions within other nations, in English, that shares details of this upstream data collection process, are difficult to find.
One can imagine the difficulties in reporting from tens of thousands of hospitals with unequal economic development (as Covid Tracking Project hints at with their State Data Quality Grade). Belgium stated well the problem of standardizing these disparate data sources. In reporting the prevalence of Covid 19 in Belgium, The Health, Food Chain Safety and Environment, a Federal Public Service of Belgium, noted their wide range of data sources:
“In practice, we collect the data reported to us by: the national reference lab; the hospitals; the residential care centres; the General Practitioners (GPs); and the network of sentinel GPs and hospitals for the monitoring of flu-like syndrome.”[i]
On problems, they go on to write that: “The various sources do not always report the same type of data by any means, and the manner and frequency of reporting can also vary.”[ii]
Harmonization is an attempt at comparison across different units, and the comparison of Covid 19 counts depends on this aggregation from localities to the national level, and a harmonization process that makes these counts comparable across nations and time.
Yet, we cannot assume that the data situation of quality and availability for Canada is the same as for Iran or Russia, for example. Indeed, in Iran, as reported in The New Yorker, the data may be compromised for political reasons:
“Soon, Iran became a global center of the coronavirus, with nearly seventy thousand reported cases and four thousand deaths. But the government maintained tight control over information; according to a leaked official document, the Revolutionary Guard ordered hospitals to hand over death tallies before releasing them to the public.”[iii]
In May 2020, Russia experienced a huge upswing in cases, but reported low mortality. In the article, “Experts Question Russian Data on Covid-19 Death Toll”[iv]
“Russian Deputy Prime Minister Tatyana Golikova Tuesday rejected suggestions Russia was understating the death rate. ‘That’s what it is and we never manipulate official data,’ she said.”
Yet, critics of Russia have questioned it:
“Russian authorities detained the leader of an independent doctors’ union, an outspoken critic of the Kremlin who has dismissed as ‘lies’ the country’s low official numbers for coronavirus infections.”[v]
Even in the US, there have been recent complaints that states, for reasons unknown, have found errors in their Covid-19 counts. An article by NBC news from May 25, 2020, “’I’m looking for the truth’: States face criticism for COVID-19 data cover-ups” summarizes some of the headlines since the beginning of May. Georgia apologized for a “processing error” of a negative count trend. And
“Florida officials last month stopped releasing the list of coronavirus deaths being compiled by the state’s medical examiners, which had at times shown a higher death toll than the total being published by the state. State officials said that list needed to be reviewed as a result of the discrepancy.”[vi]

The extent of Covid-19 was under-reported
Indeed, widespread is the idea that counts, due in part to different definitions of what a case is and whether someone died of Covid-19 or by something else, are under-reported. (the Coronavirus conspiracists argue that it is an over-count, but without much logic to the argument) The New York Times reported “63,000 Missing Deaths: Tracking the True Toll of the Coronavirus Outbreak”[vii] and The Economist reported that “Official covid-19 death tolls still under-count the true number of fatalities.”[viii] “The data is limited,” writes The New York Times, “and, if anything, excess deaths are underestimated because not all deaths have been reported.”[ix]
This situation reminds us that all data collection processes contain error. These errors can negligibly or severely impact the statistics derived from it. Errors can come from humans, from machines, or from some combination of the two. Some errors are extremely difficult to identify. In the midst of a pandemic, where people and systems are severely stressed, and where data collection systems are not standardized across or within nations, errors of all kinds will emerge. One reason for changes in the numbers of cases and deaths are simply the continual re-definitions of “what is a case” and what counts as a fatality due to Covid 19. But, there could also be errors in the reporting process itself.
Indeed, recently, but without much observable consequences as of yet, the CDC admitted that in their harmonization and aggregation of data, they combined serology tests for antibodies with diagnostic tests of active viral infection, a data situation that may have led to a slight over-count of the number of Americans who have and who were tested for Covid 19 (it may lead to NUR, or non-unique records, the definition of which is found in Slomczynski et al 2018).
In the NYT article, blame was attributed to too much pressure and too much work in too short span of time, an understandable situation that unfortunately led to poor decision making:
“Epidemiologists, state health officials and a spokeswoman for the C.D.C. said there was no ill intent; they attributed the flawed reporting system to confusion and fatigue in overworked state and local health departments that typically track infections — not tests — during outbreaks. The C.D.C. relies on states to report their data.”[x]
The CDC, and many state health officials, recognized the error and will separate these counts in their reporting, they wrote.
Across time, counts fluctuated daily. As WHO reports, “Due to differences in reporting methods, retrospective data consolidation, and reporting delays, the number of new cases may not always reflect the exact difference between yesterday’s and today’s totals.”[xi] To guide data collection, WHO provided guidelines for case reporting and have a “Revised case report form for Confirmed Novel Coronavirus COVID-19 (report to WHO within 48 hours of case identification).”[xii]
Reporting across and within nations is surely a harmonization problem. The New York Times effort to track COVID 19 reports:
“In tracking the cases, the reporting process is labor-intensive but straightforward much of the time. But with dozens of states and hundreds of local health departments using their own reporting methods — and sometimes moving patients from county to county or state to state with no explanation — judgment calls have sometimes been required.”[xiii]
The COVID Tracking Project for the US reported that the data situation improved: “Reporting on even basic testing data was very patchy when we first began collecting data in early March, but is mostly now well reported.”[xiv] Still, they had “State data quality grades,” ranging from A+ (best, such as Iowa) to F (worst, such as Arkansas).
Certainly, for cross-national harmonization or aggregation of data, there are differences between nations in how reporting of cases upstream to health administrators happens. WHO and CDC provide case reporting forms accessible on their websites. The CDC seemed to make great efforts to standardize reporting. To improve the timeliness of reporting — apparently, there had been quite a bit of manual entry of forms — the CDC has worked on electronic case reporting (eCR):
“According to the CDC, electronic case reporting (eCR) is defined as the automated generation and sending of EHR case reports to public health officials. eCR allows for automatic, complete, and accurate data to be reported in real-time. In return, it lessens burden for providers by improving the timeliness and accuracy of case reports… In an effort to reduce the healthcare system’s burden of manually completing the COVID-19 reporting forms, the CDC will make these forms available electronically.”[xv]
In the rush to collect data, errors will occur. Identifying error sources is an important part of harmonization and aggregation decisions, and thus the future use of these data for social scientists. One error source is the continual re-definitions of cases and mortality. Another source is upstream reporting from hospitals and labs, etc. to national health authorities. A much more nefarious source is from politically-motivated deliberate under-counts that would derail the possibility of harmonizing administrative data on Covid 19 counts from some countries.
Conclusion
The early COVID-19 pandemic revealed major weaknesses in global data infrastructures, including redundancy, lack of transparency, and inconsistent standards.
To prepare for future crises, it is essential to improve how data are collected, harmonized, and verified. A more robust system would help policymakers, researchers, and the public make better decisions based on more reliable information. Key actions include:
- Standardize definitions and reporting protocols across countries and institutions.
- Increase transparency about data sources, collection methods, and known limitations.
- Invest in independent data verification to detect and correct errors early.
- Reduce reliance on secondary sources by strengthening primary data collection at the local level.
- Support electronic, real-time data reporting to minimize delays and manual errors.
See also:
Local Data and Upstream Reporting as Sources of Error in the Covid 19 Undercount
COVID-19 Counts of Cases and Deaths Reveal Social Group Biases
[i] “The COVID-19 figures: collection, verification and publication,” April 14, 2020
https://web.archive.org/web/*/https://www.info-coronavirus.be/en/news/collection-data/
[ii] “The COVID-19 figures: collection, verification and publication,” April 14, 2020
https://web.archive.org/web/*/https://www.info-coronavirus.be/en/news/collection-data/
[iii] “The Twilight of the Iranian Revolution” by Dexter Filkins in the May 25, 2020 edition of The New Yorker https://www.newyorker.com/magazine/2020/05/25/the-twilight-of-the-iranian-revolution
[iv] “Experts Question Russian Data on Covid-19 Death Toll,” by Henry Meyer May 13, 2020
[v] “Russian Doctor Detained After Challenging Virus Figures”
By Andrew Higgins Published April 3, 2020 Updated April 10, 2020
[vi] “’I’m looking for the truth’: States face criticism for COVID-19 data cover-ups” May 25, 2020, by Allan Smith https://web.archive.org/web/20200525164215/https://www.nbcnews.com/politics/politics-news/i-m-looking-truth-states-face-criticism-covid-19-data-n1202086
[vii] https://www.nytimes.com/interactive/2020/04/21/world/coronavirus-missing-deaths.html
[viii] https://web.archive.org/web/*/https://www.economist.com/graphic-detail/2020/04/16/tracking-covid-19-excess-deaths-across-countries
[ix] https://www.nytimes.com/interactive/2020/04/21/world/coronavirus-missing-deaths.html. See also an article in The Independent, who writes: “One reason was for the time-lag in cases being reported, and how information about the disease included in coroners’ reports was not always complete. Factors such as a person dying because they were too afraid to go hospital would likely not be included.”
[x] “C.D.C. Test Counting Error Leaves Epidemiologists ‘Really Baffled’” by Sheryl Gay Stolberg, Sheila Kaplan and Sarah Mervosh May 22, 2020 https://web.archive.org/web/20200526230234/https://www.nytimes.com/2020/05/22/us/politics/coronavirus-tests-cdc.html
[xi] From “Coronavirus disease 2019 (COVID-19) Situation Report – 96”
[xii] They are protective of this publicly available resource. At the bottom of this document they wrote:
“This is a draft. The content of this document is not final, and the text may be subject to revisions before publication. The document may not be reviewed, abstracted, quoted, reproduced, transmitted, distributed, translated or adapted, in part or in whole, in any form or by any means without the permission of the World Health Organization.”
[xiii] “We’re Sharing Coronavirus Case Data for Every U.S. County” by The New York Times
March 28, 2020
[xiv] https://covidtracking.com/about-data
[xv] “CDC Unveils FHIR-Based COVID-19 EHR Reporting Application” by Christopher Jason April 20, 2020
https://ehrintelligence.com/news/cdc-unveils-fhir-based-covid-19-ehr-reporting-application
This does not describe how individual states conduct upstream reporting. I found on county that described it, in part. According to Pinal County, Arizona: “How are COVID-19 cases reported?
All infectious diseases, including COVID-19 cases, are reported to local Public Health departments through an electronic platform known as MEDSIS (Medical Electronic Disease Surveillance Intelligence System). Our epidemiologist team manually checks each of the data entered to ensure the data is accurate.”
https://www.govserv.org/US/Florence/726925130750461/Pinal-County-Board-of-Supervisors
[i] They do mention the other sources, but as topics. Specifically, they write:
“This includes websites of ministries of health (43% of the total number of sources), websites of public health institutes (9%), websites from other national authorities (ministries of social services and welfare, governments, prime minister cabinets, cabinets of ministries, websites on health statistics and official response teams) (6%), WHO websites and WHO situation reports (2%), and official dashboards and interactive maps from national and international institutions (10%). In addition, ECDC screens social media accounts maintained by national authorities, for example Twitter, Facebook, YouTube or Telegram accounts run by ministries of health (28%) and other official sources (e.g. official media outlets) (2%). Several media and social media sources are screened to gather additional information which can be validated with the official sources previously mentioned. Only cases and deaths reported by the national and regional competent authorities from the countries and territories listed are aggregated in our database.” https://www.ecdc.europa.eu/en/covid-19/data-collection
[ii] https://www.healthmap.org/covid-19/# reports on data source: “All data used to produce this map are exclusively collected from publicly available sources including government reports and news media.” This is all that they write about it.
[i] e.g. HealthMap provides a link to github, but Reuters Graphics does not, and instead asks the reader to contact them directly for the data.
[ii] Data selection was based on a Google search of “covid 19 data.” The list is no exhaustive, but it does cover many of the websites available on the first two pages of Google search results.
[iii] I exclude US-only sources: CDC, The COVID Tracking Project, and Wunderground
[iv] ECDC is the European Centre for Disease Prevention and Control, “An agency of the European Union”
https://web.archive.org/web/*/https://www.ecdc.europa.eu/en/covid-19-pandemic
Cover photo by Martin Sanchez on Unsplash

Joshua K. Dubrow is a PhD from The Ohio State University and a Professor of Sociology at the Polish Academy of Sciences.
